Audit Log
AI Audit Log – Trace
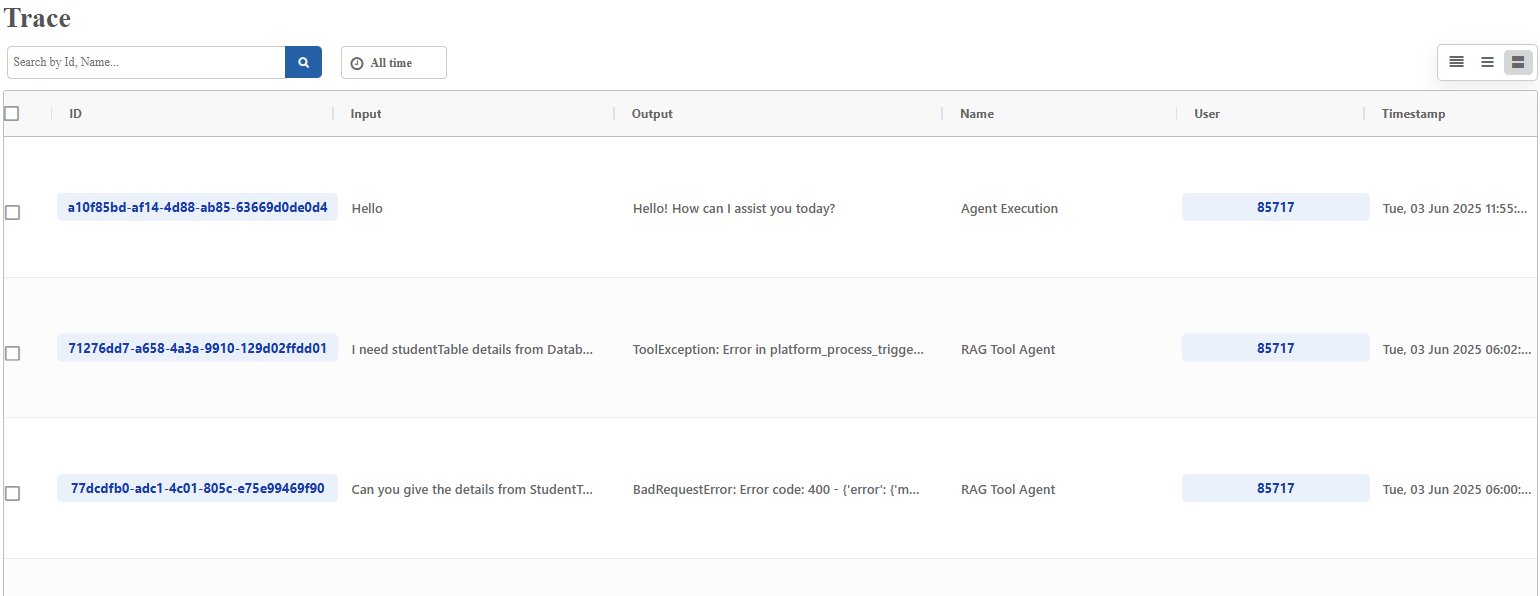
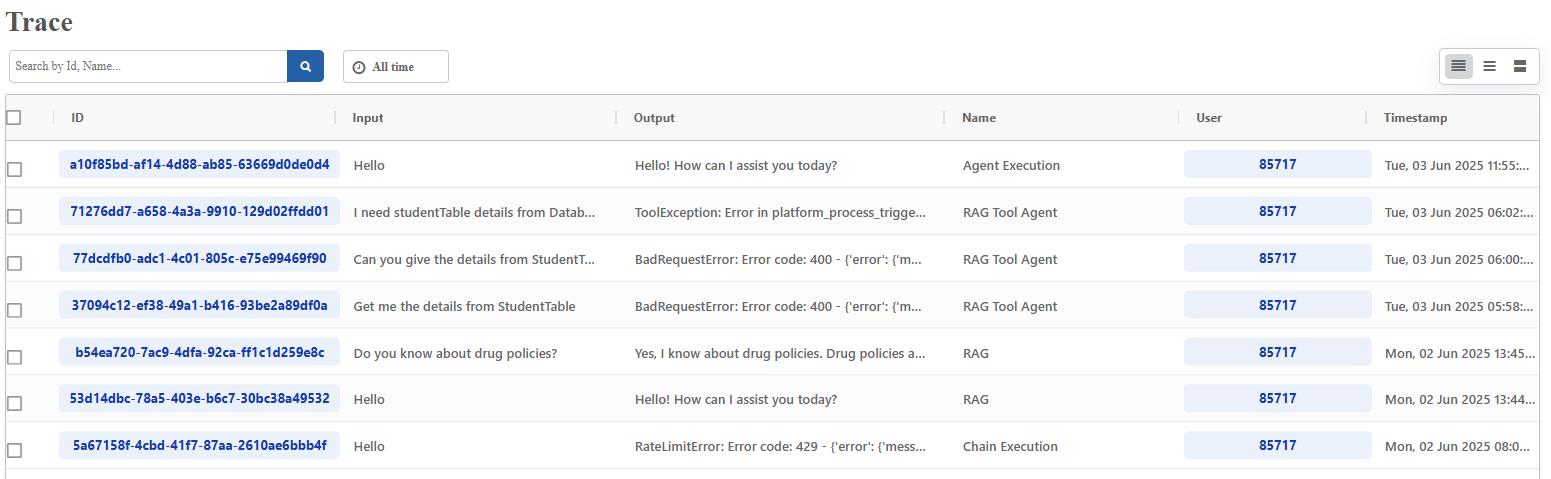
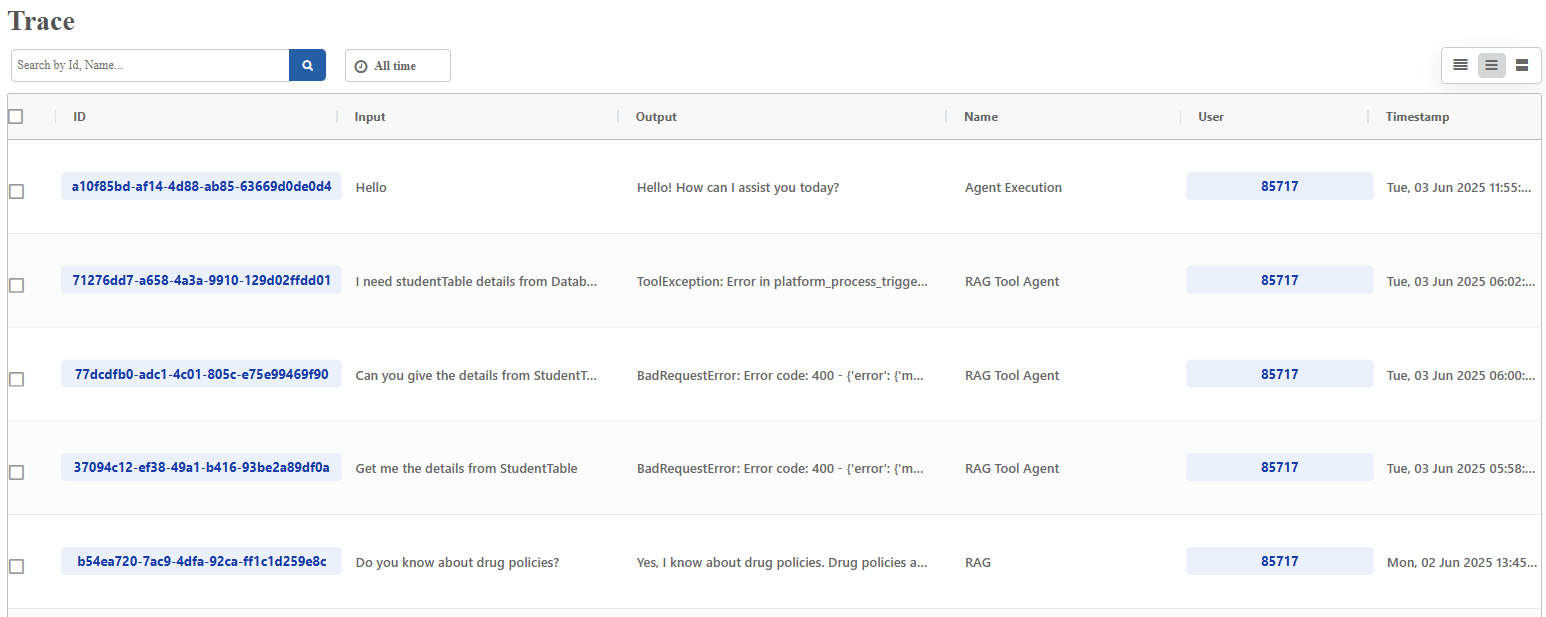
Trace is a detailed, chronological record of every significant step, decision, and interaction made by the AI agent during its process of responding to a user query or executing a specific task. It comprises of the complete story of how that agent processed a particular request, including every relevant event and the associated data (ID, input, output, name, user, timestamp, latency).
GenAI Audit Log page displays the GenAI agent trace details.
It displays the details for the logged in user only.
Accessing the Trace
- Go to Main Menu > GenIQ > AI Audit page. Trace details of the log appear.
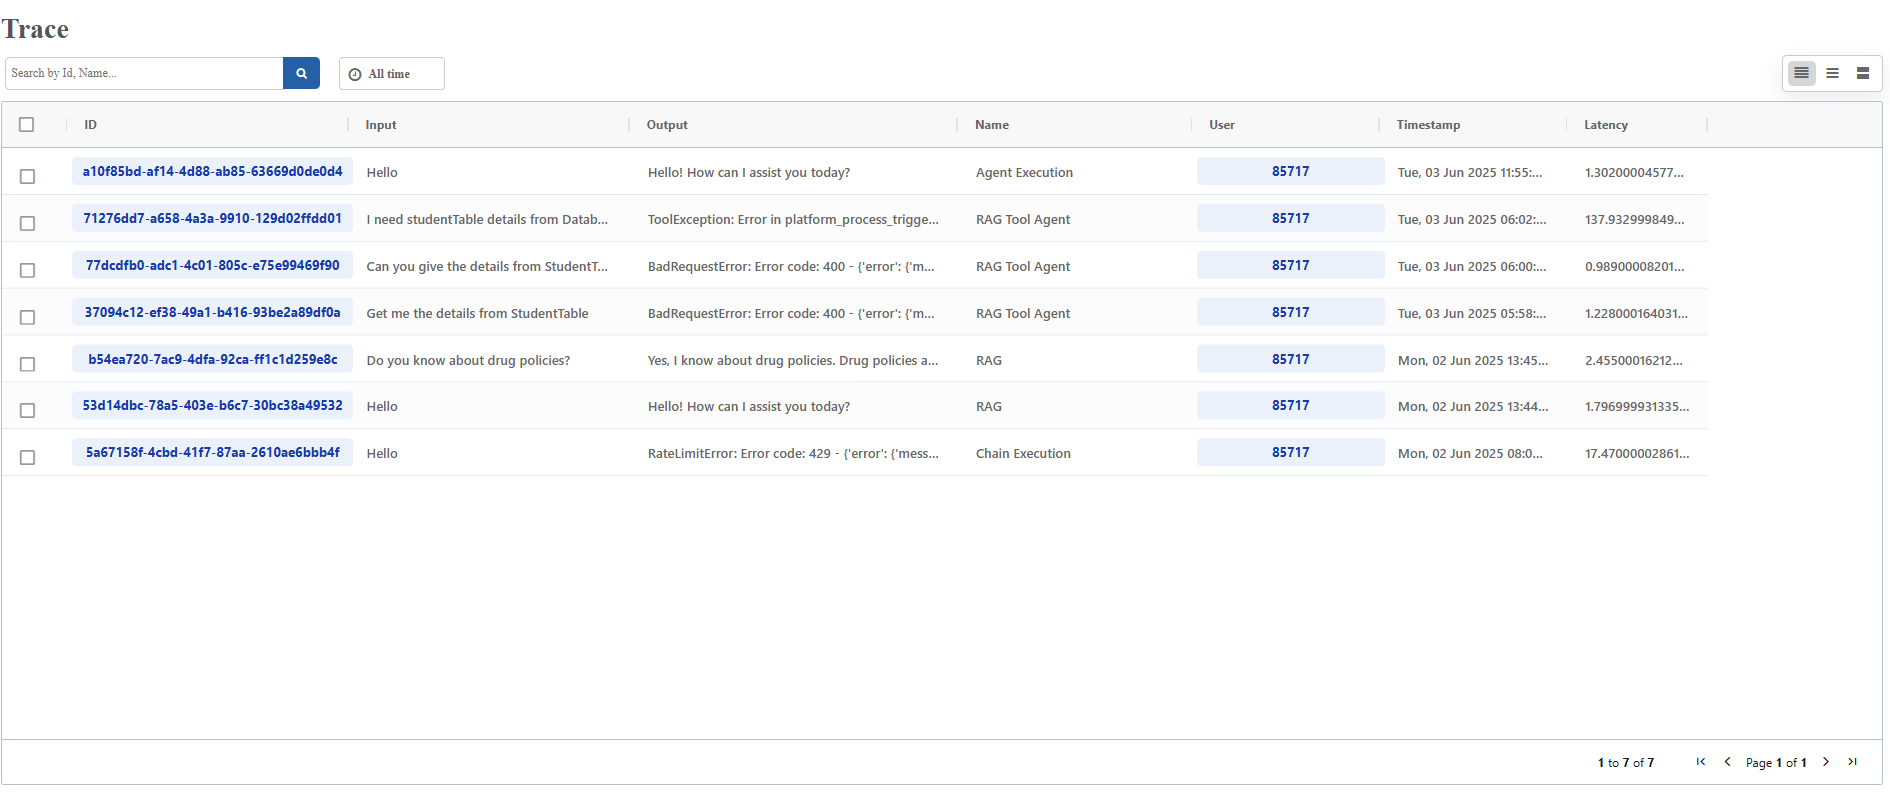
The audit log displays the following column details.
- Select box: Allows you to select multiple row details.
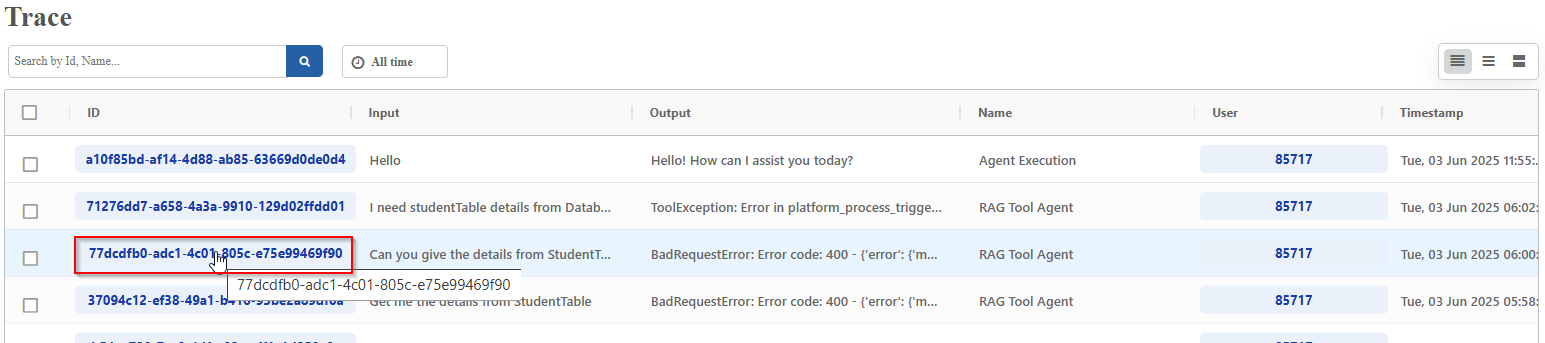
- ID: A unique identifier assigned to each request, session, or specific operation within the audit log. Click the ID to view the trace details of that ID. Refer to Trace Details.
- Input: The input request given by the user.
- Output: The response generated by the agent to the user's question.
- Name: Name of the execution. It indicates what is executed in the background to give the user a response.
- Agent Execution: Indicates that the results are generated by the agent configurations and LLM.
- RAG: Indicates that the results are generated using RAG pipelines.
- RAG Tool Agent: Indicates that the results are generated by the Tool that uses RAG.
- Chain Execution: Indicates that the results are generated as a result of a deliberate sequence of actions involving different "tools" (or internal modules) to gather the necessary information.
- User: User ID of the user who initiated the request or interaction with the AI agent.
- Timestamp: Date and time when the log entry was recorded or when the associated event occurred.
- Latency: Latency refers to the time taken for a specific operation (total time from when the user sends a query until the agent returns a final response) or component to complete its task. It is measured in seconds (s).
Latency is a key performance indicator (KPI). High latency can indicate bottlenecks, inefficient processes, or slow external API calls, leading to a poor user experience. Low latency means the agent is responding quickly.
Trace Details
Trace details are captured from individual requests or sessions. The system generates a unique ID for each request.
-
On the AI Audit Log -Trace > click the ID in the ID column.
-
Click Tree > Preview. The execution tree appears on the right side. Details of the selected item on the tree appear on the left side.
By default, the Tree > Preview tab is active, and the trace preview details appear for the selected ID.
-
Click and select an execution under the Tree tab.
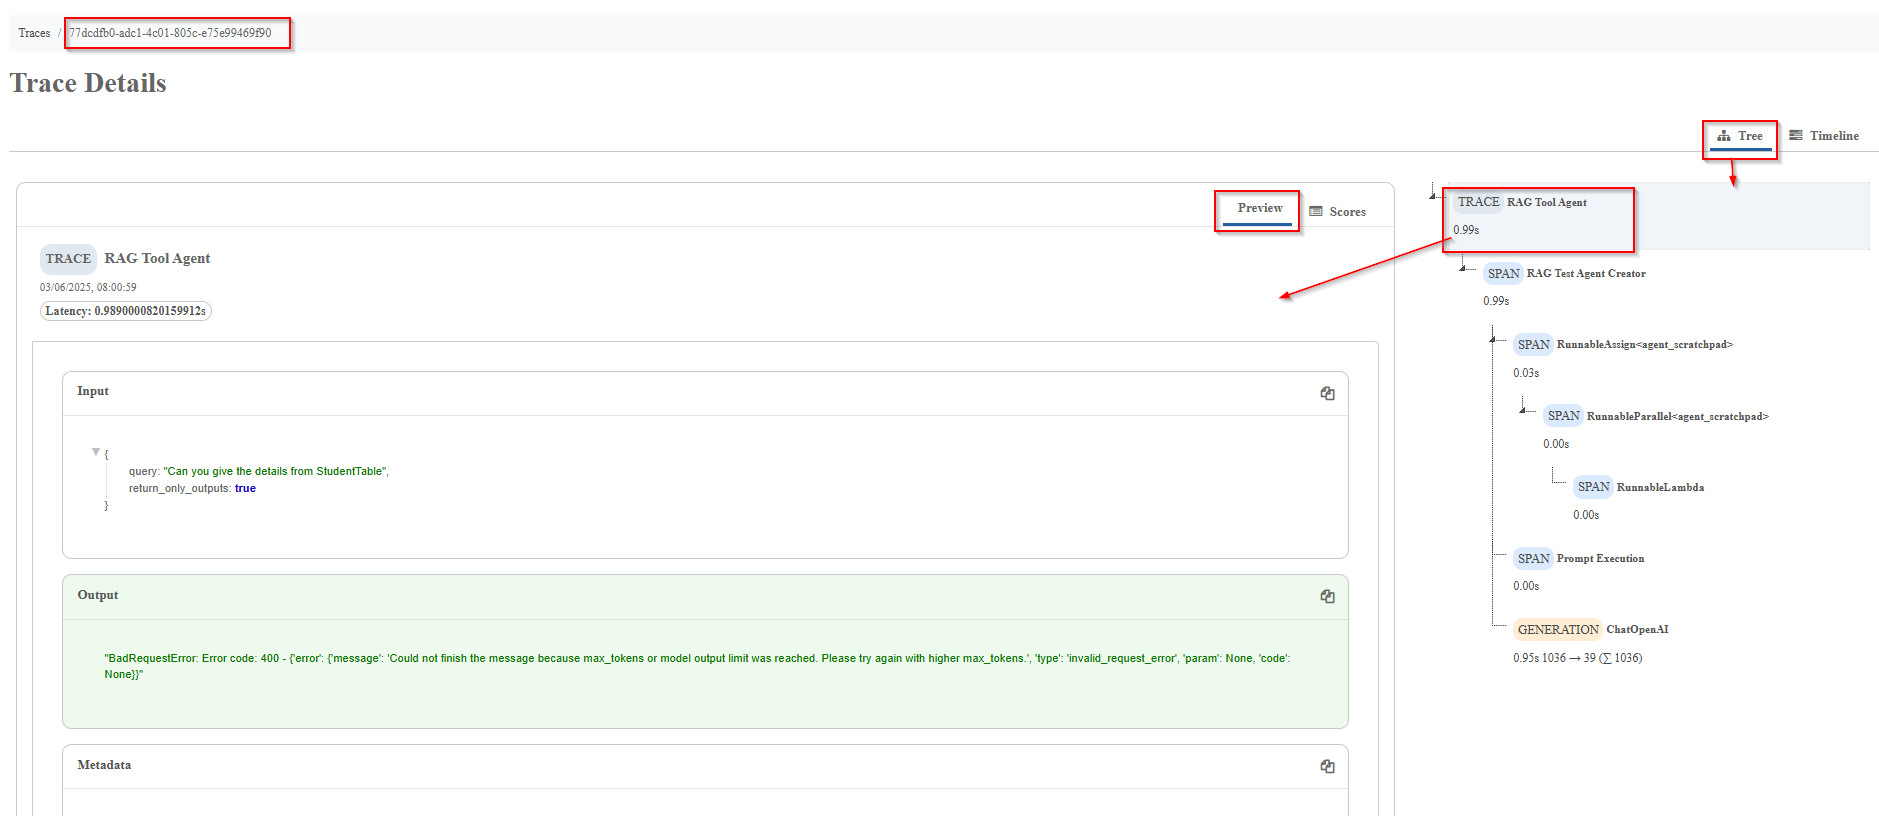
The details of the selected execution appear on the left side “Preview” tab.
-
Click the Scores tab to view the score details.
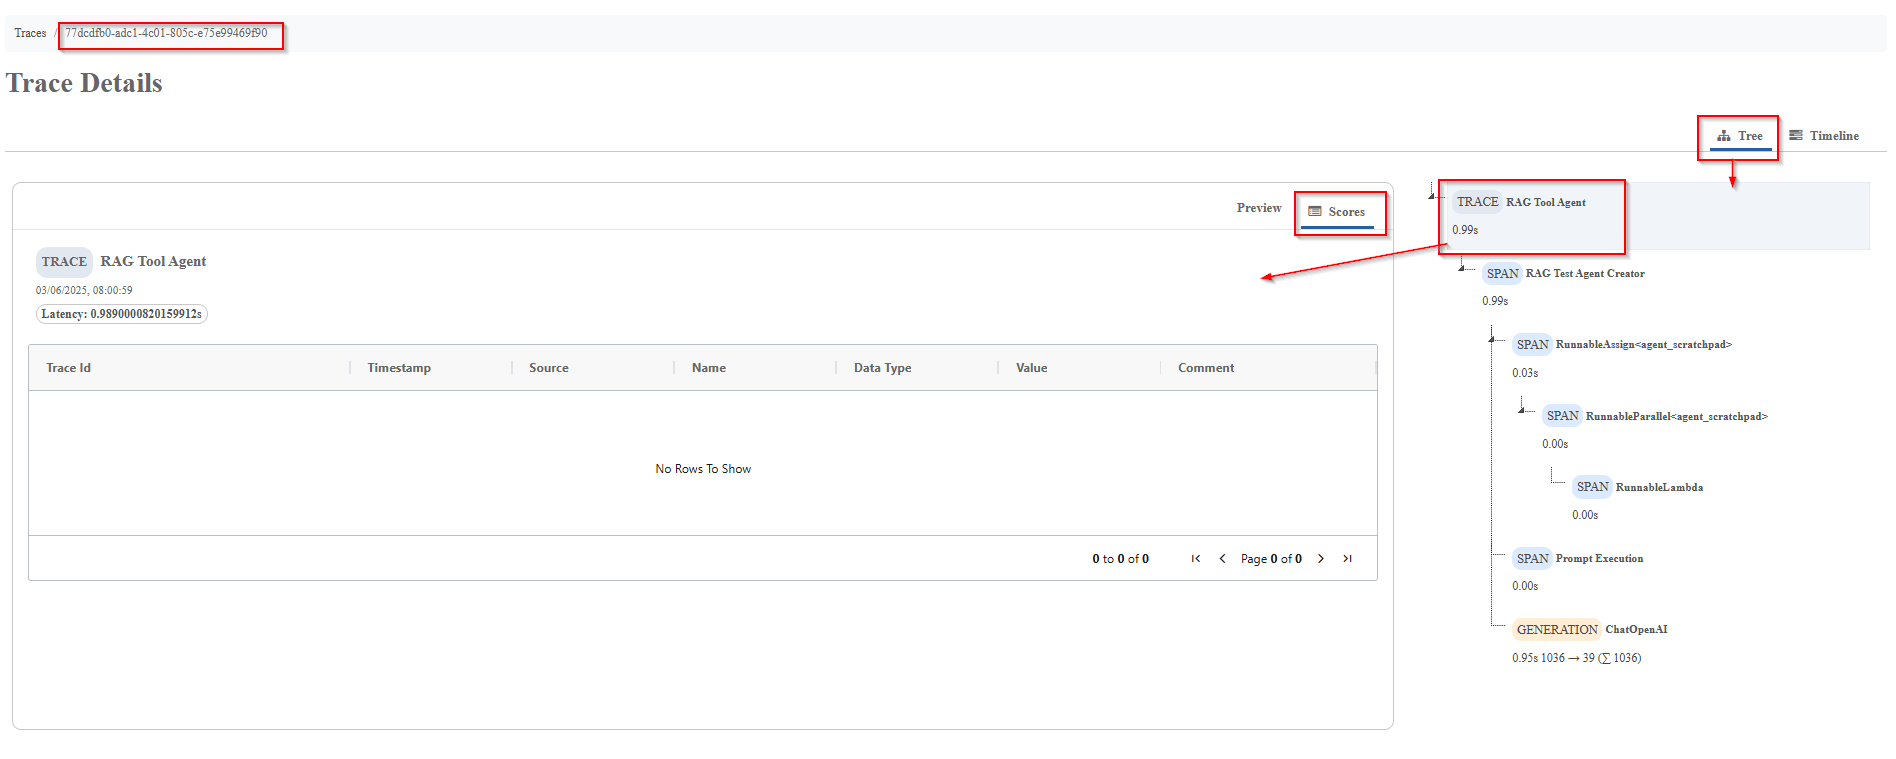
The scores of the selected execution appear on the left side.
-
Click the Timeline tab adjacent to the Tree tab to view the timeline details for the selected ID.
The Trace Timeline tree appears on the left side, and the time in seconds appears on the right side.
Click a timeline item from the tree to view the corresponding time details.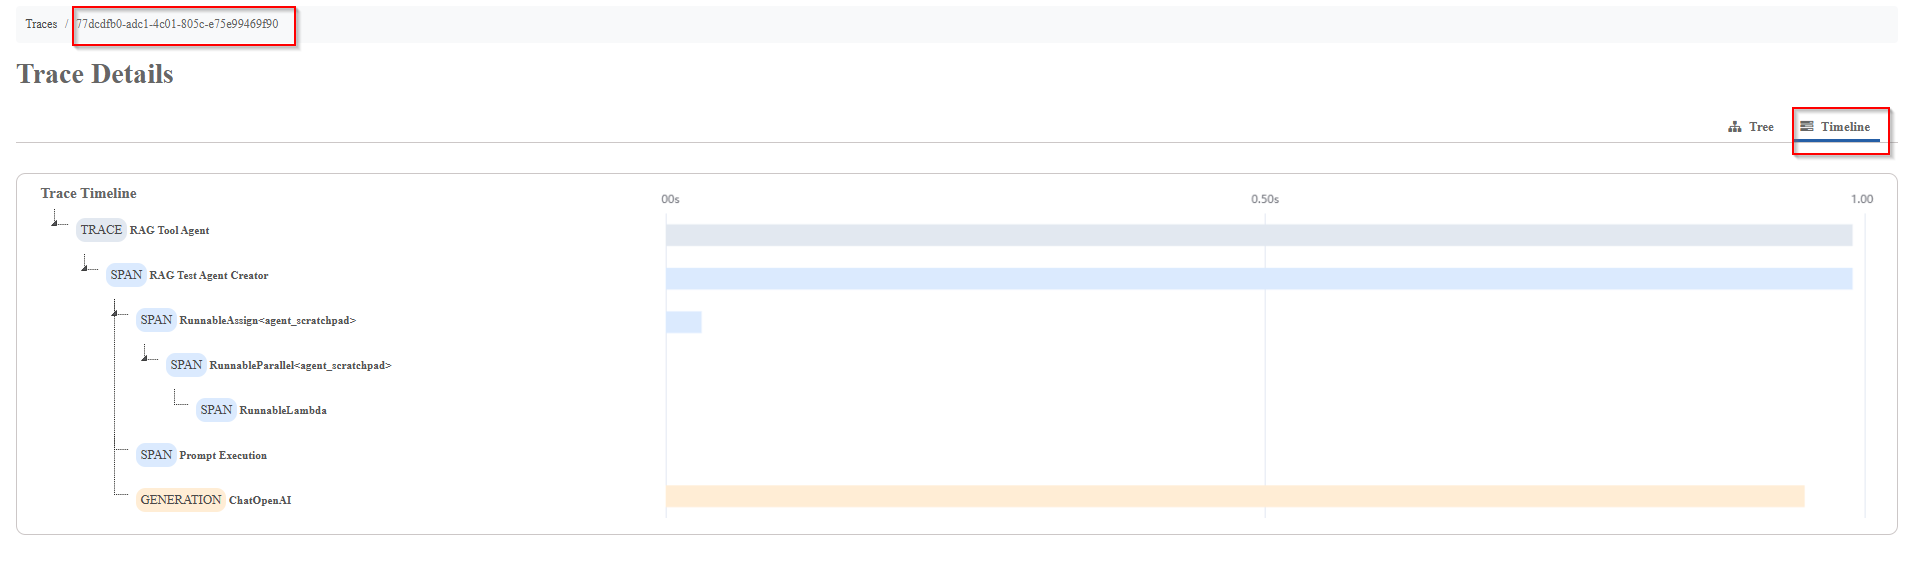
Understanding TRACE, SPAN, and GENERATION
The trace tree and trace timeline have multiple categories within the trace of agent actions.
TRACE: The entire, end-to-end journey of a single user request or operation as it flows through your AI agent and any integrated components (RAG system, tools, etc.).
SPAN: Span is a single, distinct unit of work within a larger Trace. Each Span provides detailed context and latency information for that specific operation, helping you pinpoint where time is being spent or where errors occur within the overall flow. Spans can be nested (a parent span can have child spans). Each span has a latency.
GENERATION: A specific type of Span (or a key event within a Span) that represents the act of an LLM producing textual output. This could be the final answer, an intermediate thought process.
Filter By Agent
The filter by agent feature allows you to filter the details of a particular agent by its trace ID or trace execution name.

-
Enter the trace ID (ID column) or the execution type name (Name column) and click the search icon. The page will list the log details of the provided agent. The time filter allows you to filter the details for the past “n time” (n is a set of predefined values).
-
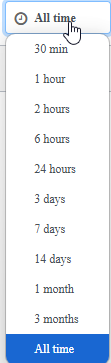
Click the All time button. The time selection list appears.
- Select a time. The logs until that time are listed. If you select “All time”, all the logs till now for that agent appear.
Trace Views
The top right of the trace grid displays the view options for the trace grid.
Click the view icons and the corresponding view appears.
 : Condensed view
 : Expanded view

: More expanded view